Dashboard: everything important on one page
Dashboard puts the state of your repos, limits and sessions on one page. Look here in the morning and you see where to start.
-
01Open Dashboard
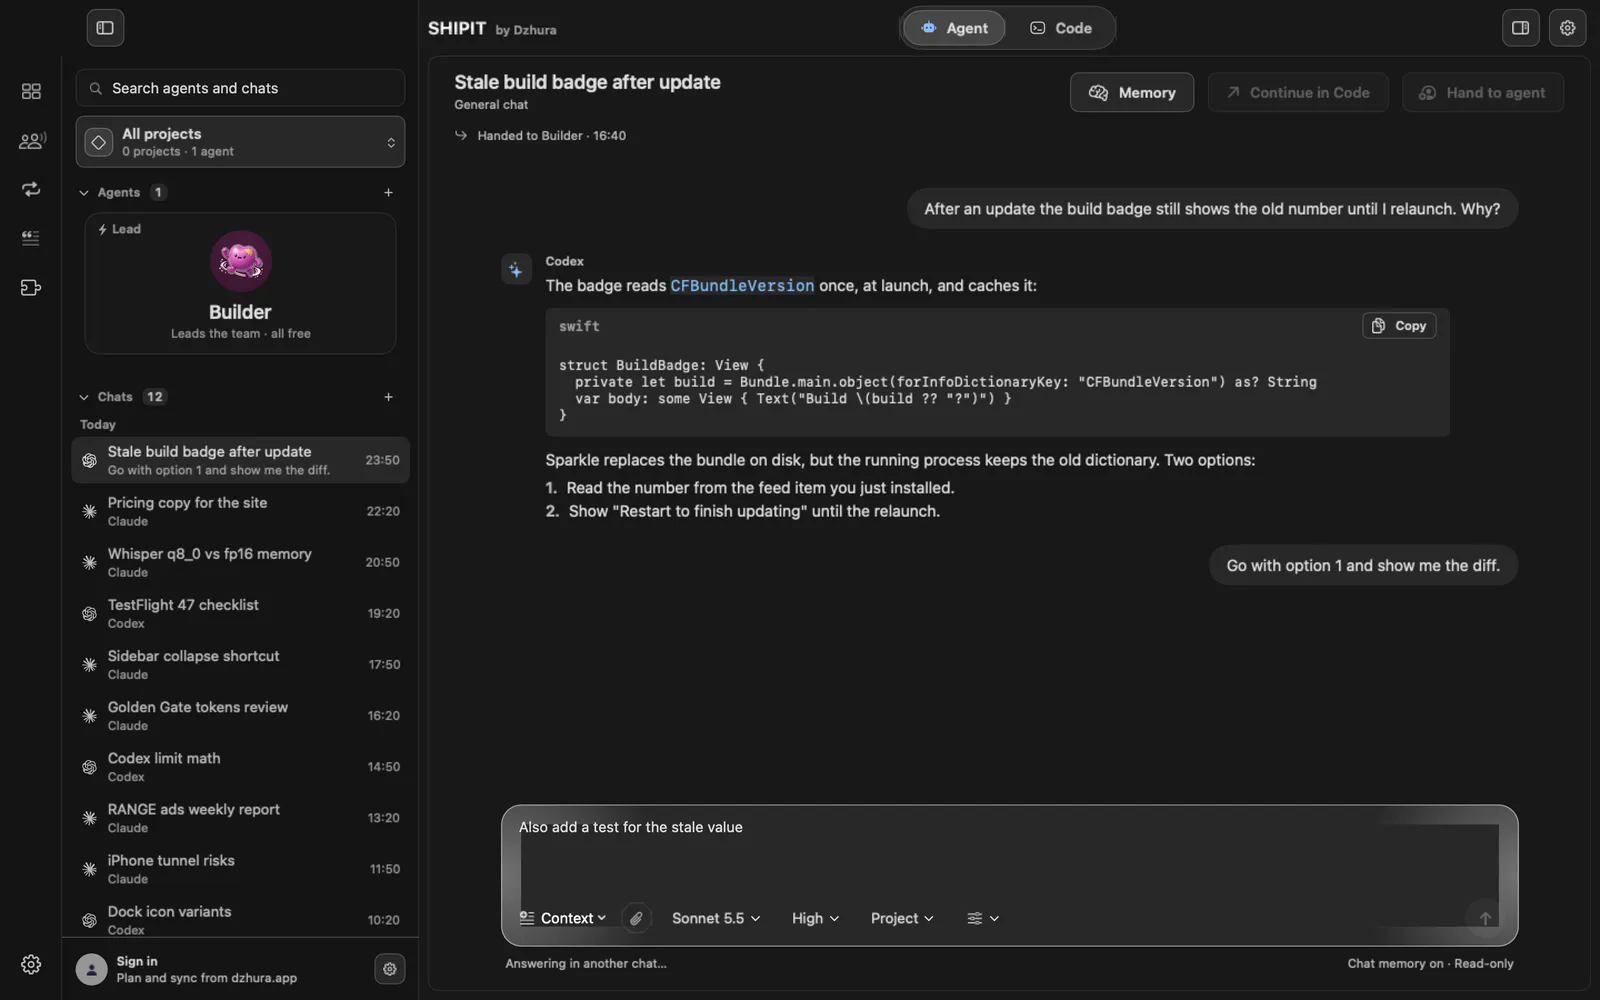
Dashboard is in the sidebar on the Intermediate and Pro levels. In the narrow column on the left it is the first icon, the grid.
-
02What broke
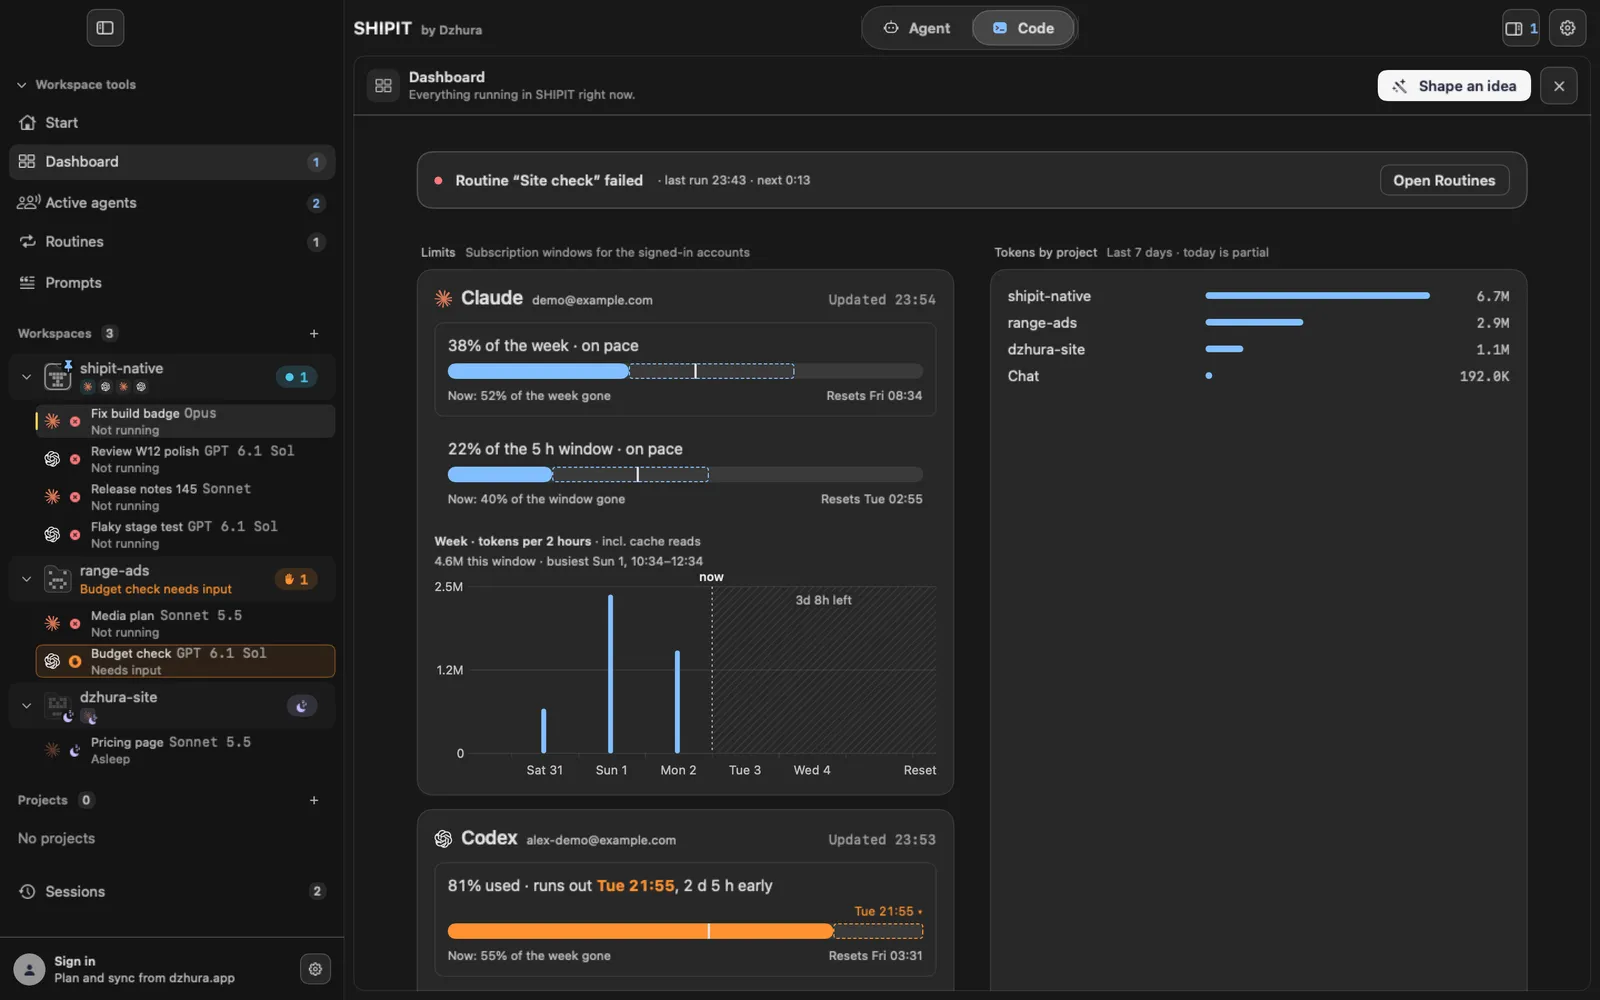
When a routine fails or a plugin stops working, a strip with a red dot appears at the top. The button in its row takes you straight to Routines or Plugins.
When all is well, there is no strip at all.
-
03Repos
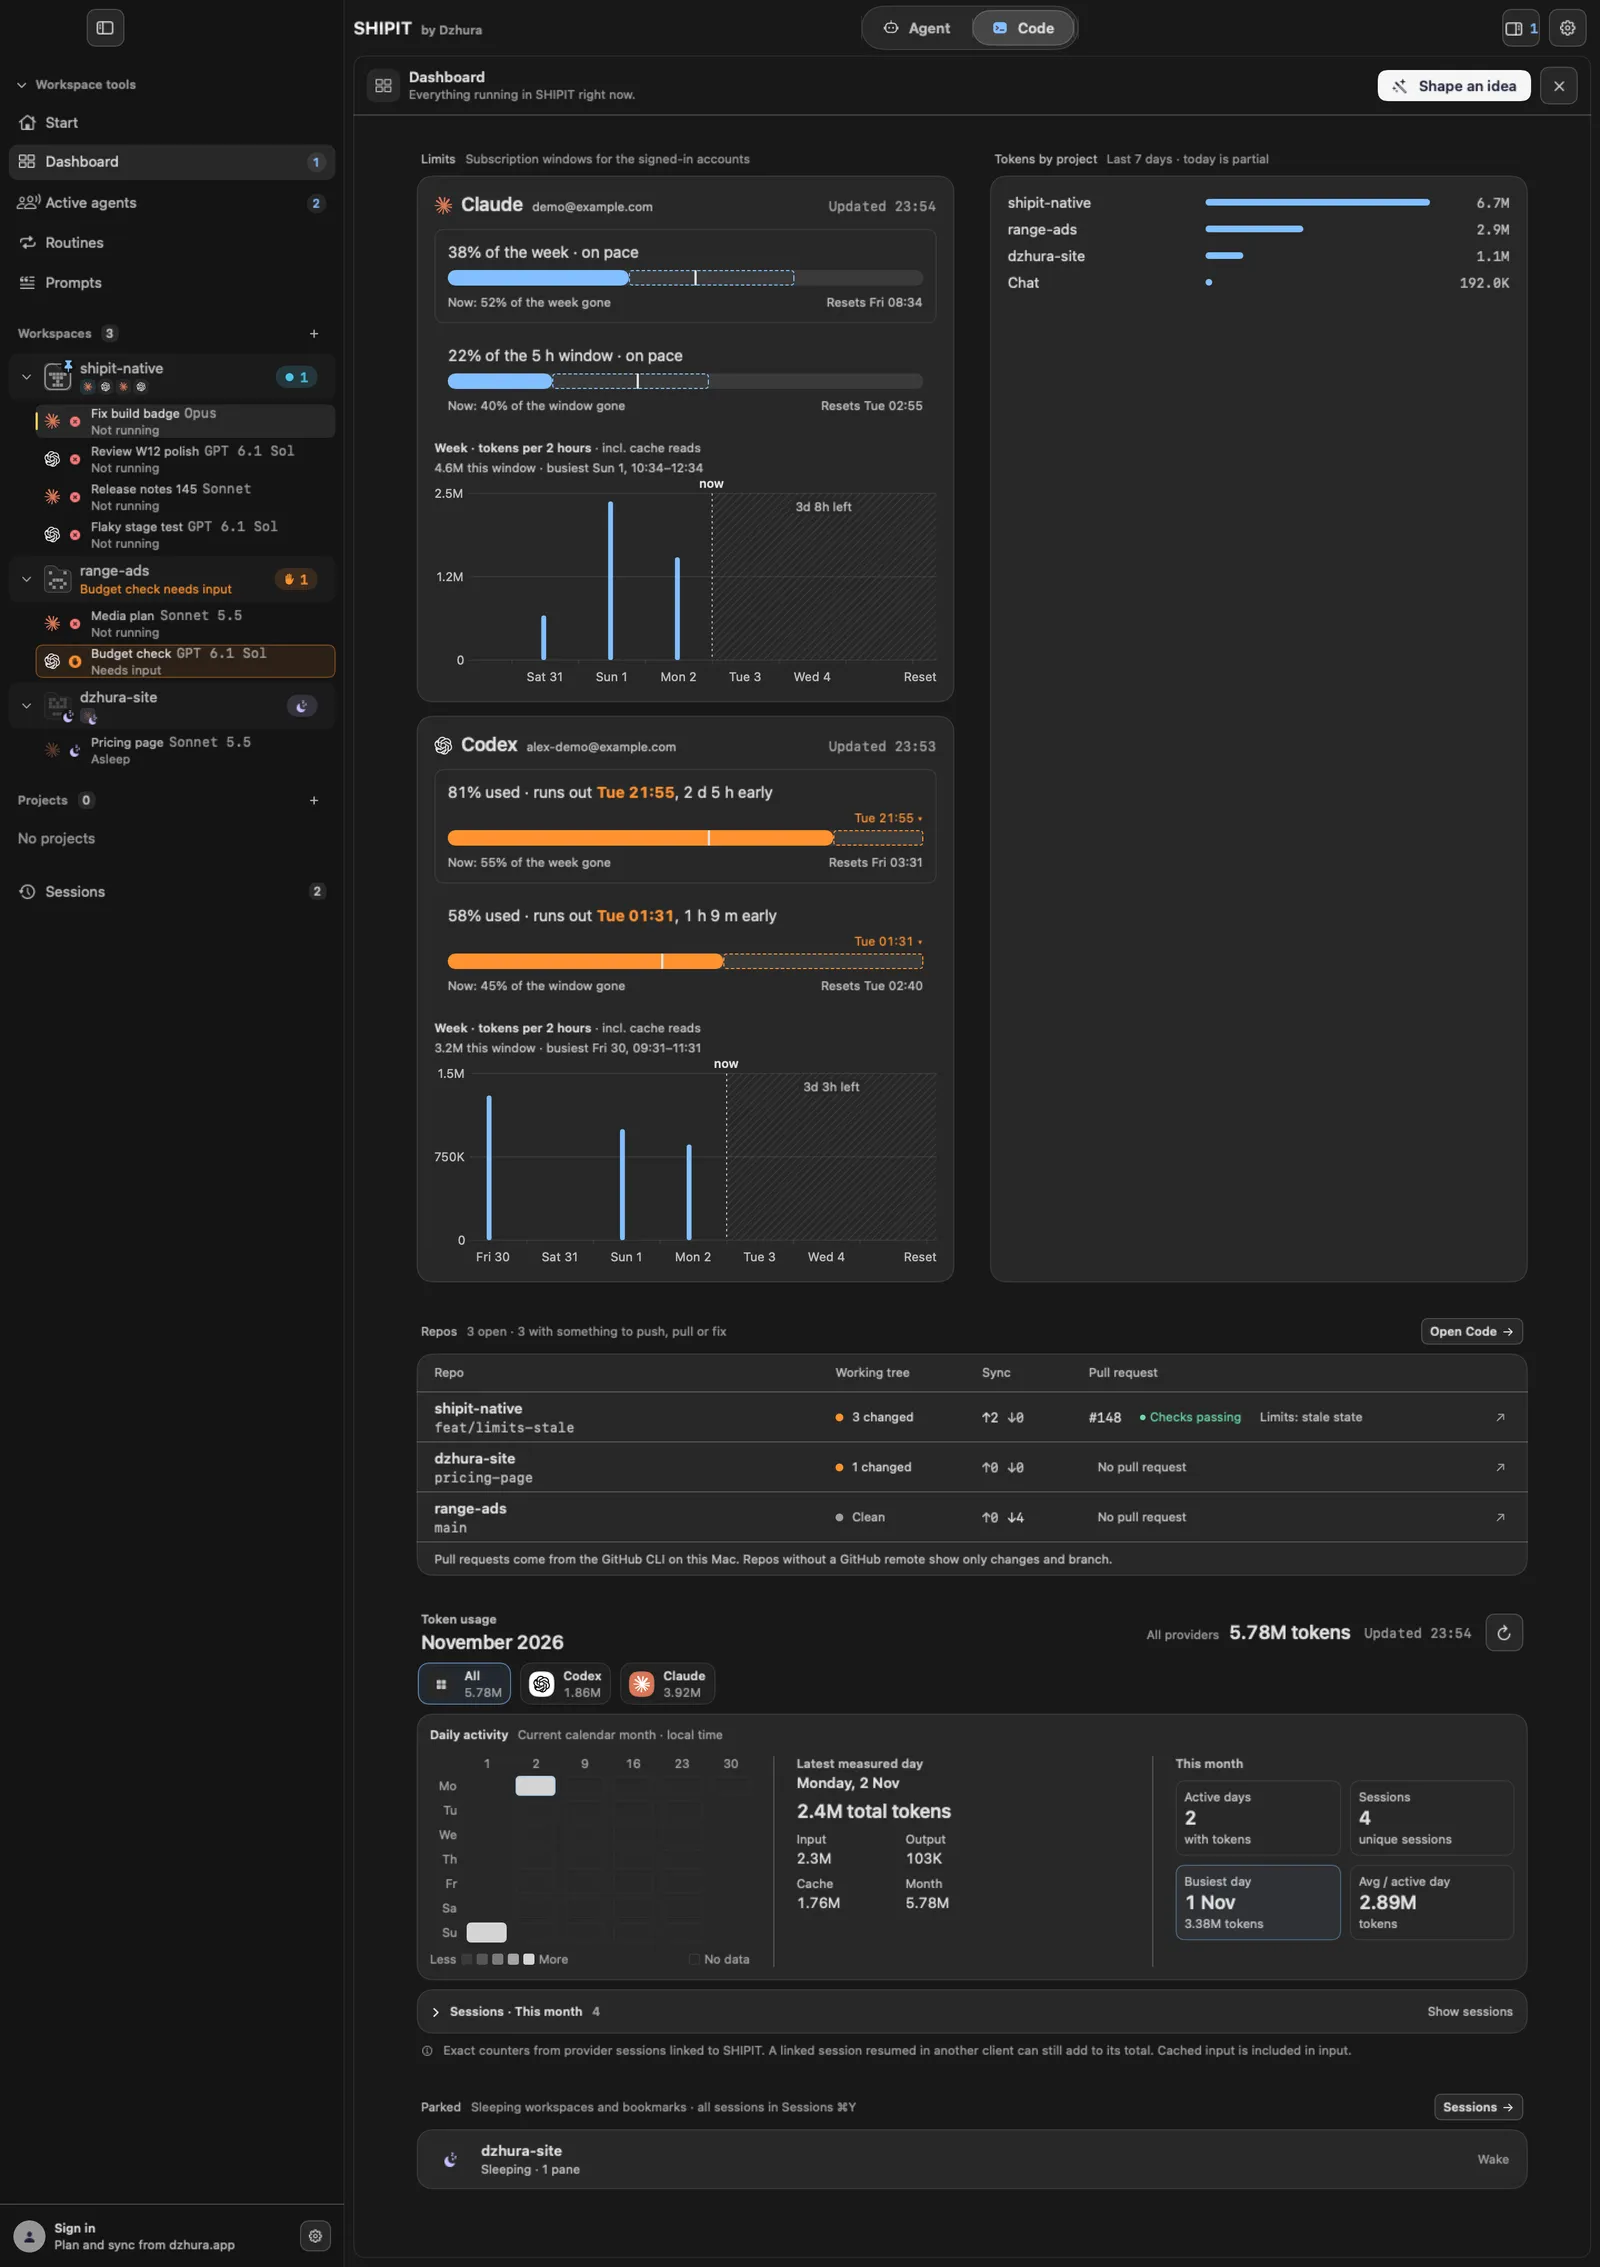
Repos: every workspace from Code, its branch, uncommitted changes and the
↑↓arrows for how far ahead or behind the remote branch you are.Pull requests come from the GitHub CLI on this Mac. A repo without GitHub shows only the branch and changes. The button next to the title opens Code.
TipThe list is read again every time you open Dashboard.
-
04Limits and tokens
Limits: the subscription windows of the accounts you are signed in to. Tokens by project: the last 7 days, with today still partial.
Below are Token usage and Daily activity. How to read the limits is covered in its own guide.
-
05Parked
Parked: sleeping workspaces and bookmarks.
The button next to the title opens all Sessions.
⌘Ydoes the same from anywhere.
Tips
- Dashboard starts nothing by itself: it only shows and takes you where you can act.
- An empty Repos section means no project is open in Code yet.
Questions
Why are there no pull requests?
They come from the GitHub CLI on this Mac. If it is not installed or you are not signed in to it, you see only the branch and changes.
Where is Dashboard on the Beginner level?
It is not there. Change the level in Settings › General, under Experience.
Next
- Usage and limitsThe Dashboard shows how much is left in each subscription window and when it resets, so you do not hit a limit mid-task.
- Routines: an agent on a scheduleA routine is a message to an agent that SHIPIT sends by itself on a schedule. A code review every morning or a report every Monday, with no reminders.
- Plugins: services your agents can useA plugin gives an agent the tools of another service: GitHub, mail, payments, hosting. You connect a service once and decide which agents may use it.